monitoringartist/grafana-xxl
Dockerized Grafana 5.x/4.x/3.x with all preinstalled (community) plugins from grafana.net
5M+
monitoringartist/grafana-xxl repository overview
Grafana XXL



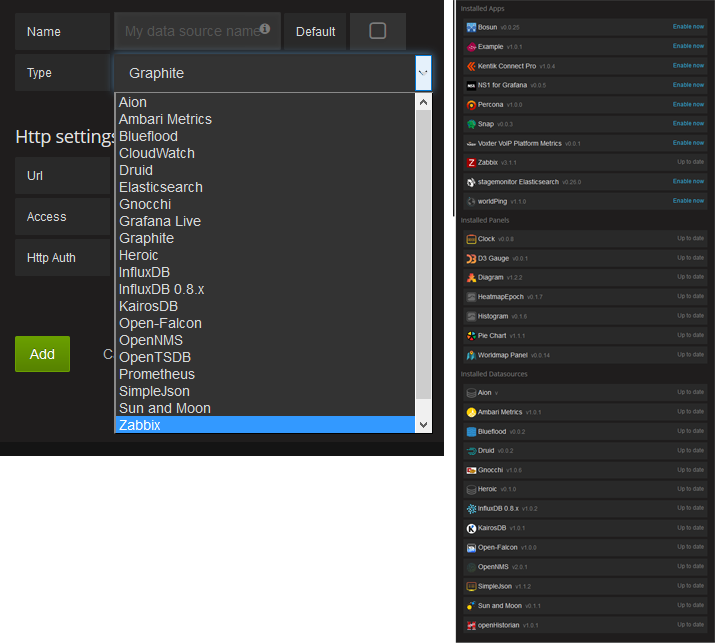
Dockerized Grafana with all preinstalled plugins from https://grafana.net/plugins.
Please donate to author, so he can continue to publish another awesome projects for free:

Running your Grafana XXL Docker image
Start your image binding the external port 3000:
docker run -d --name=grafana-xxl -p 3000:3000 monitoringartist/grafana-xxl:latest
Try it out, default admin user is admin/admin.
Grafana XXL with persistent storage (recommended)
# create /var/lib/grafana as persistent volume storage
docker run -d -v /var/lib/grafana --name grafana-xxl-storage busybox:latest

# start grafana-xxl
docker run \
  -d \
  -p 3000:3000 \
  --name grafana-xxl \
  --volumes-from grafana-xxl-storage \
  monitoringartist/grafana-xxl:latest
Running specific version of Grafana XXL
# specify right tag, e.g. 2.6,3.1,dev (latest nigthly build) - see Docker Hub for available tags
docker run \
  -d \
  -p 3000:3000 \
  --name grafana-xxl \
  monitoringartist/grafana-xxl:dev
Building Grafana XXL for ARM
You need ARM-version Grafana's deb (for example from here). Also you need ARM-version of gosu (from here)
# armhf
docker build \
  --tag grafana-xxl \
  --build-arg GRAFANA_DEB_URL=https://github.com/fg2it/grafana-on-raspberry/releases/download/v5.0.4/grafana_5.0.4_armhf.deb \
  --build-arg GOSU_BIN_URL=https://github.com/tianon/gosu/releases/download/1.10/gosu-armhf .

# arm64
docker build \
  --tag grafana-xxl \
  --build-arg GRAFANA_DEB_URL=https://github.com/fg2it/grafana-on-raspberry/releases/download/v5.0.4/grafana_5.0.4_arm64.deb \
  --build-arg GOSU_BIN_URL=https://github.com/tianon/gosu/releases/download/1.10/gosu-arm64 .
Configuring your Grafana container
All options defined in conf/grafana.ini can be overriden using environment variables by using the syntax GF__. For example:
docker run \
  -d \
  -p 3000:3000 \
  --name=grafana-xxl \
  -e "GF_SERVER_ROOT_URL=http://grafana.server.name" \
  -e "GF_SECURITY_ADMIN_PASSWORD=secret" \
  monitoringartist/grafana-xxl:latest
More information in the grafana configuration documentation: http://docs.grafana.org/installation/configuration/
Configuring AWS credentials for CloudWatch support (only Grafana 3.+)
docker run \
  -d \
  -p 3000:3000 \
  --name=grafana-xxl \
  -e "GF_AWS_PROFILES=default" \
  -e "GF_AWS_default_ACCESS_KEY_ID=YOUR_ACCESS_KEY" \
  -e "GF_AWS_default_SECRET_ACCESS_KEY=YOUR_SECRET_KEY" \
  -e "GF_AWS_default_REGION=eu-west-1" \
  monitoringartist/grafana-xxl:latest
You may also specify multiple profiles to GF_AWS_PROFILES (e.g.
GF_AWS_PROFILES=default another).
Supported variables:
GF_AWS_PROFILES: list of AWS profiles for Cloudwatch datasourceGF_AWS_${profile}_ACCESS_KEY_ID: AWS access key ID (required).GF_AWS_${profile}_SECRET_ACCESS_KEY: AWS secret access key (required).GF_AWS_${profile}_REGION: AWS region (optional).
Auto upgrade plugins
Container tries to upgrade all installed plugins in the container automatically before Grafana start. If you want to disable this behaviour, please use environment variable -e UPGRADEALL=false.
Supported monitoring services
Integrations
- Puppet for dockerized grafana-xxl
- Ansible for dockerized grafana-xxl
- docker-compose for dockerized grafana-xxl
Author
Devops Monitoring Expert, who loves monitoring systems and cutting/bleeding edge technologies: Docker, Kubernetes, ECS, AWS, Google GCP, Terraform, Lambda, Zabbix, Grafana, Elasticsearch, Kibana, Prometheus, Sysdig, ...
Summary:
- 1000+ GitHub stars
- 6000+ Grafana dashboard downloads
- 800 000+ Docker image pulls
Professional devops / monitoring / consulting services:

Tag summary
Content type
Image
Digest
Size
1.7 GB
Last updated
almost 5 years ago
docker pull monitoringartist/grafana-xxl